How to Read and Analyze Price Charts: Part One

Pazar Araştırması
If you ever opened a trading platform of any regulated broker Finteria alike, you could see cascading lines and green/red sticks over the coordinate system as you would do a graph in Math classes at school. To read the charts, a clear understanding of what a candlestick is a must to perform technical analysis. By doing research of the market price before entering the trade, a novice trader will not end up in FOMO (Fear Of Missing Out) as of result of a lackluster approach to trading the assets.
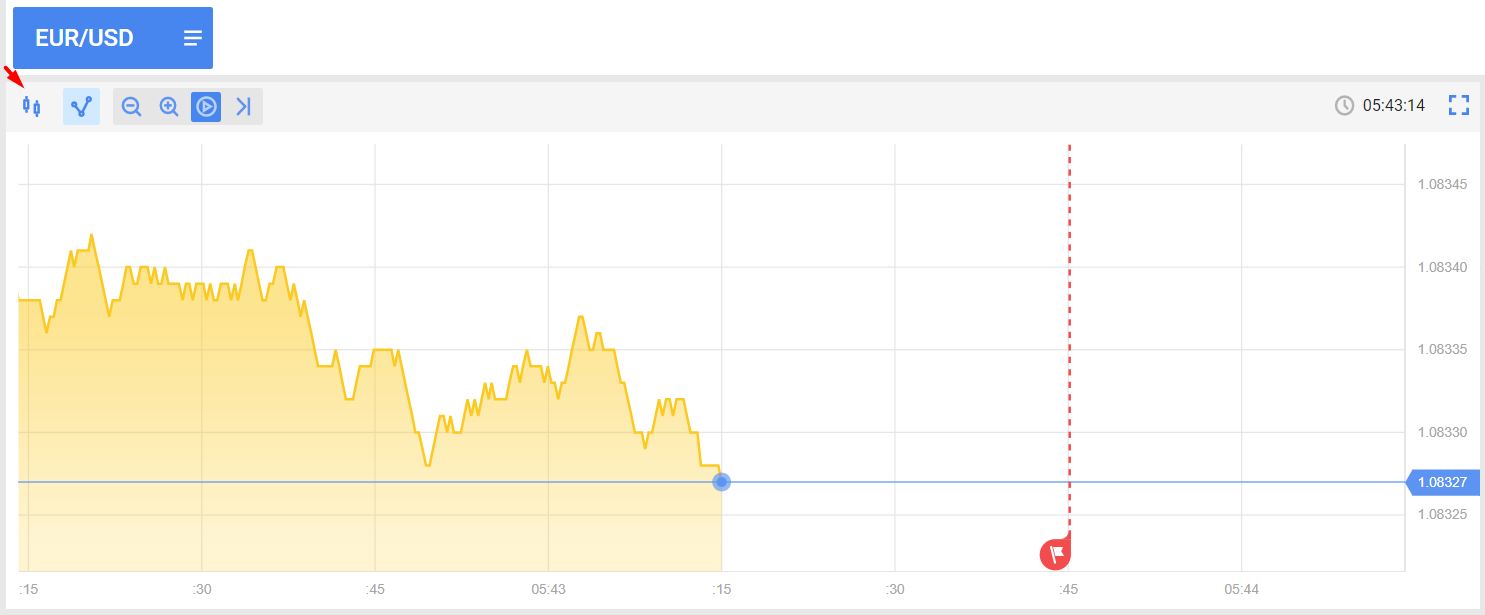
Before entering the guide on reading the price charts, make sure you switched to the candlestick chart on Finteria binary options trading platform.
Candlestick Structure: All The Price Info You Need
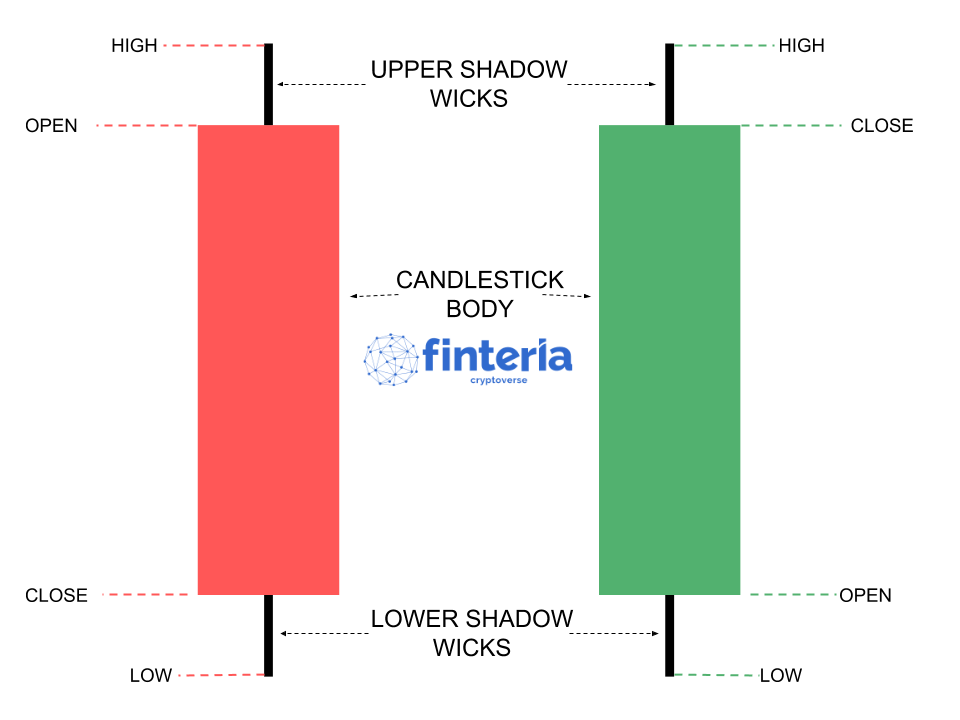
On Figure 1, we examine the structure of a candlestick - it can tell us the high, low, open, and close price at a given time period.
Two Important Candlesticks to Start With
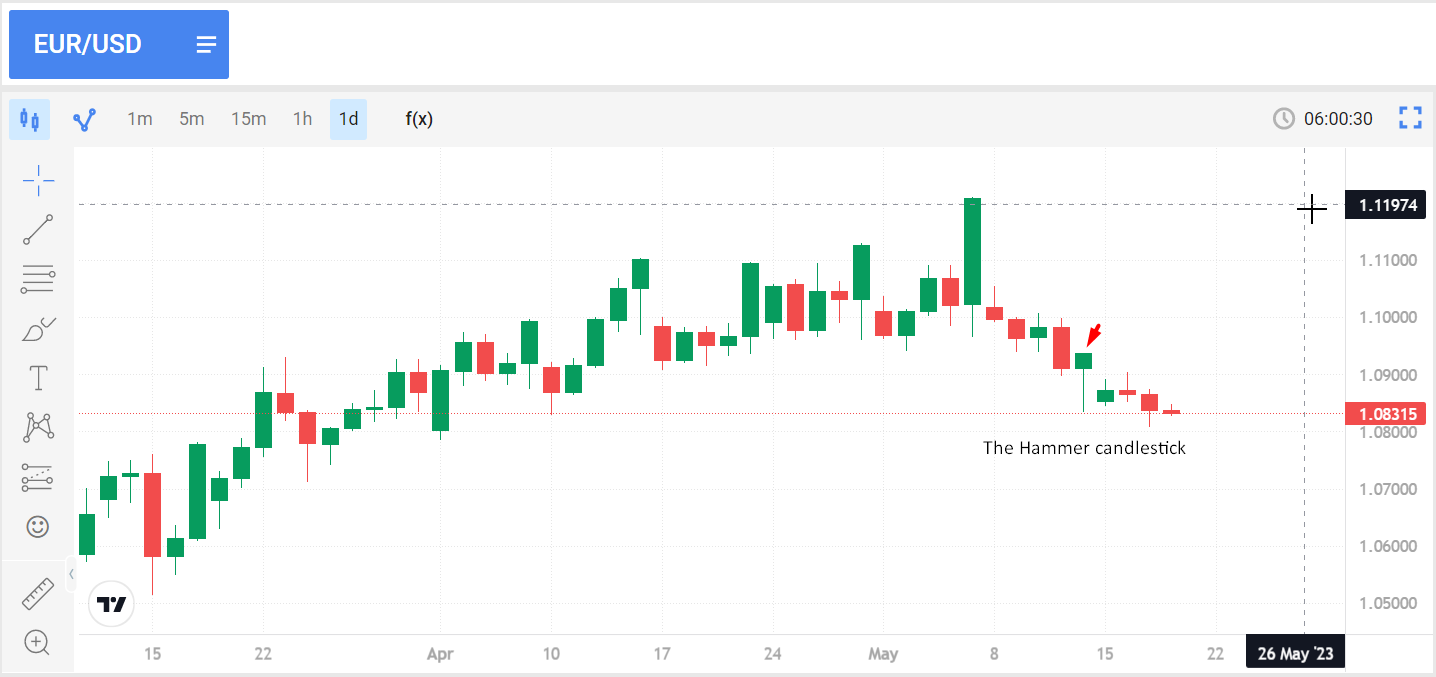
There are a handful of candlesticks to play with, but let’s start with the most important two - the Hammer and Engulfing . To put it simply, Hammer has gotten its name due to the resemblance with its iron prototype - it has a short body and a long lower wick. This candlestick can be seen at potential bottoms of the price history.
Here is a real-time example of a Hammer candlestick for the EUR/USD instrument spotted on Finteria platform on May 14.
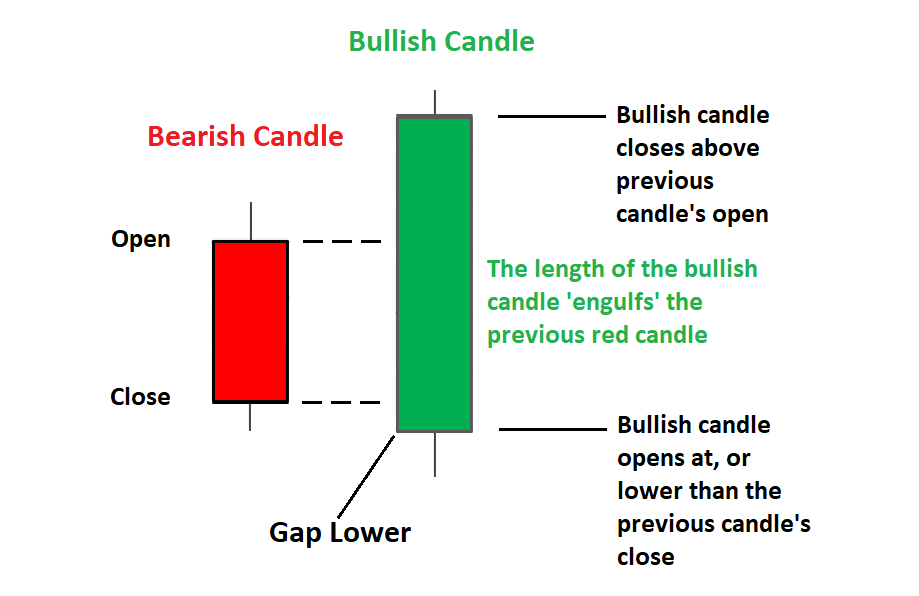
The Engulfing Candlestick occurs when a move gets invalidated as a result of a sudden price movement in the opposite direction by the next candle. Figure 3 elaborates on how to spot this candlestick to see a potential bullish rally.
How Can Candlesticks Improve Your Trading?
To understand candlesticks better, consider this - a candle with a long lower wick indicates that buyers have managed to increase the price by buying at this price point, despite heavy selling. A candle with a small body and a long lower wick means that the market has absorbed the supply. An example of this is the Hammer candlestick shown in Figure 2.
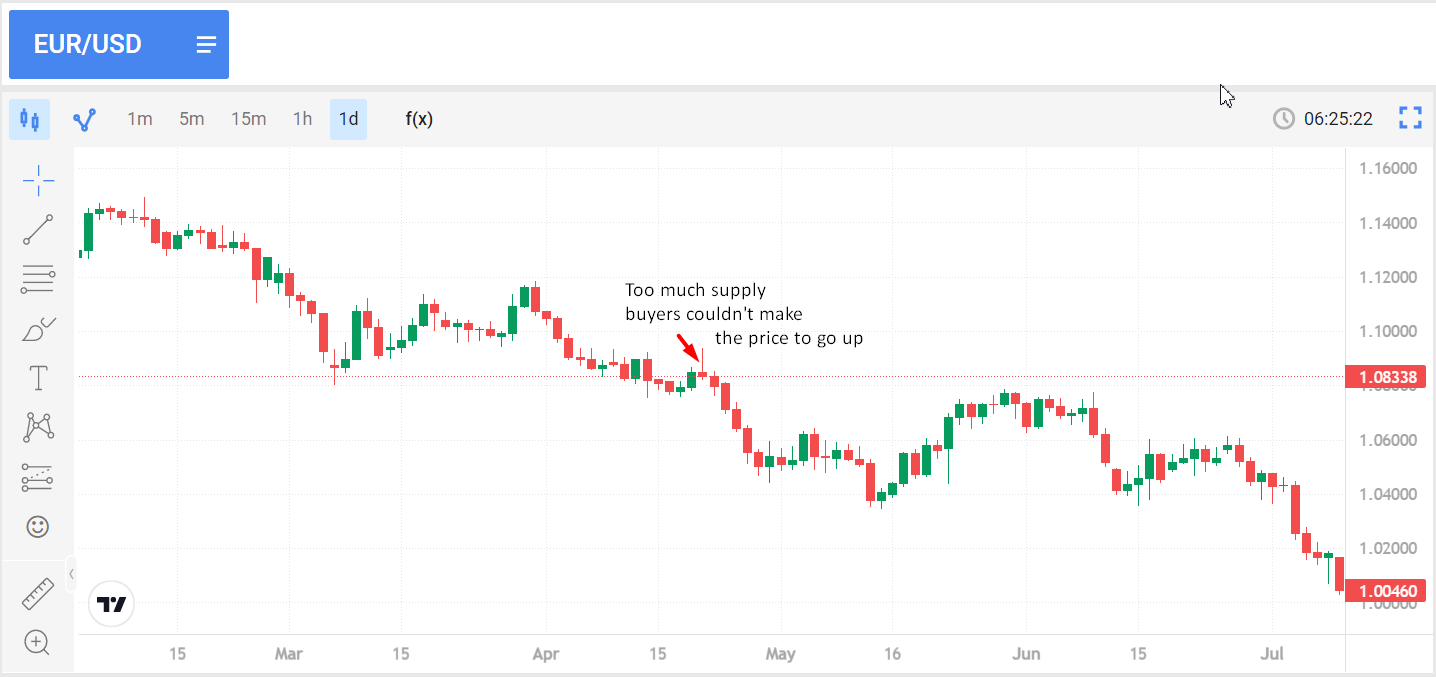
Similarly, a candle with a long upper wick is negative, or "bearish". This shows that despite buyers trying to raise the price, there was too much supply for the price to increase. Figure 4 provides a recent example of such a candlestick, after which the price kept decreasing.
By combining these two points, we see that a candle with a small body and both a long upper and lower wick signifies uncertainty or mixed feelings in the market. It could indicate a potential reversal or signal the end of a trend.
In the next guide, we will focus on identifying areas of supply and demand on the chart to help you make more confident high profit trades. This is a key topic to master, and after reading that tutorial, we recommend opening a Demo or Live account to practice identifying these supply and demand zones on the chart.


